TL;DR: Nothing went wrong on my servers. I built Aegis v2 anyway: a small Rust daemon with eBPF probes that watches process behaviour on Rocky Linux 10, adds the warning signs up into one risk score, and writes a single incident with the evidence attached. Version 0.1 only watches. It changes nothing on the host.
Nothing happened to my servers.
No breach. No 3 am phone call. No mysterious binary humming away in /tmp, mining someone else’s cryptocurrency on my electricity bill.
I built Aegis v2 anyway.
5 Servers Today, Hundreds Coming
Proactive is cheaper than heroic
Right now I look after five servers on my own. That’s manageable. I know what runs on each of them, roughly when the backups fire, and which one sulks after a kernel update.
Soon that number grows to a few hundred.
I’ve been doing this for 28 years, and the one thing I’m sure of is that you don’t learn what normal looks like on a fleet after something abnormal has already happened. You learn it before. Quietly. While nothing is on fire and you can still think straight.
So I wanted a tool that would sit on each box, watch how processes behave, and tell me when a pattern looks wrong. Not when a single odd thing happens. When a few odd things happen together.
The Problem With One Line Per Event
Your logs know. They just don't tell you.
Here’s a sequence that should worry anyone who runs Linux servers. Something runs a binary out of /tmp. Seconds later, the same process tree starts knocking on ports it has no business knocking on. Then it attaches a debugger to sshd.
Any one of those, on its own, can be innocent. Package managers unpack things into temp directories. Monitoring tools open lots of connections. Admins attach debuggers all the time.
All three, in one process tree, inside a minute? That’s a story.
The trouble is that most tooling hands you that story as three separate lines in three separate places, and leaves the stitching to you. Usually on Monday. Usually with coffee that’s gone cold.
What Aegis Actually Does
A score, not a pile of alerts
Aegis is a small Rust daemon with eBPF probes in the kernel. It watches every exec, fork, exit, successful ptrace attach, memfd_create call, and outbound TCP connect.
Each suspicious behaviour adds points to a risk score for that process. An exec from a temp directory is worth 25. Attaching to a system daemon is 45. A burst of outbound connects is 40. Code that only exists in memory gets 65, because that’s how fileless malware runs.
Scores halve every 30 seconds of quiet. A single weird event fades away on its own. A chain of them adds up, and children carry their parent’s history into the same incident.
At 50, Aegis opens an incident. At 80, the verdict becomes would_quarantine. Each incident is one directory on disk: the process tree, every piece of evidence with its weight, and a timeline of how the score climbed.
There’s one more piece I’m particularly stubborn about. Allowlists never trust a name. Call your payload dnf, and Aegis doesn’t care. A tool only gets a pass if the exact file the kernel ran is owned by an installed RPM and unmodified, or matches a SHA-256 you pinned yourself.
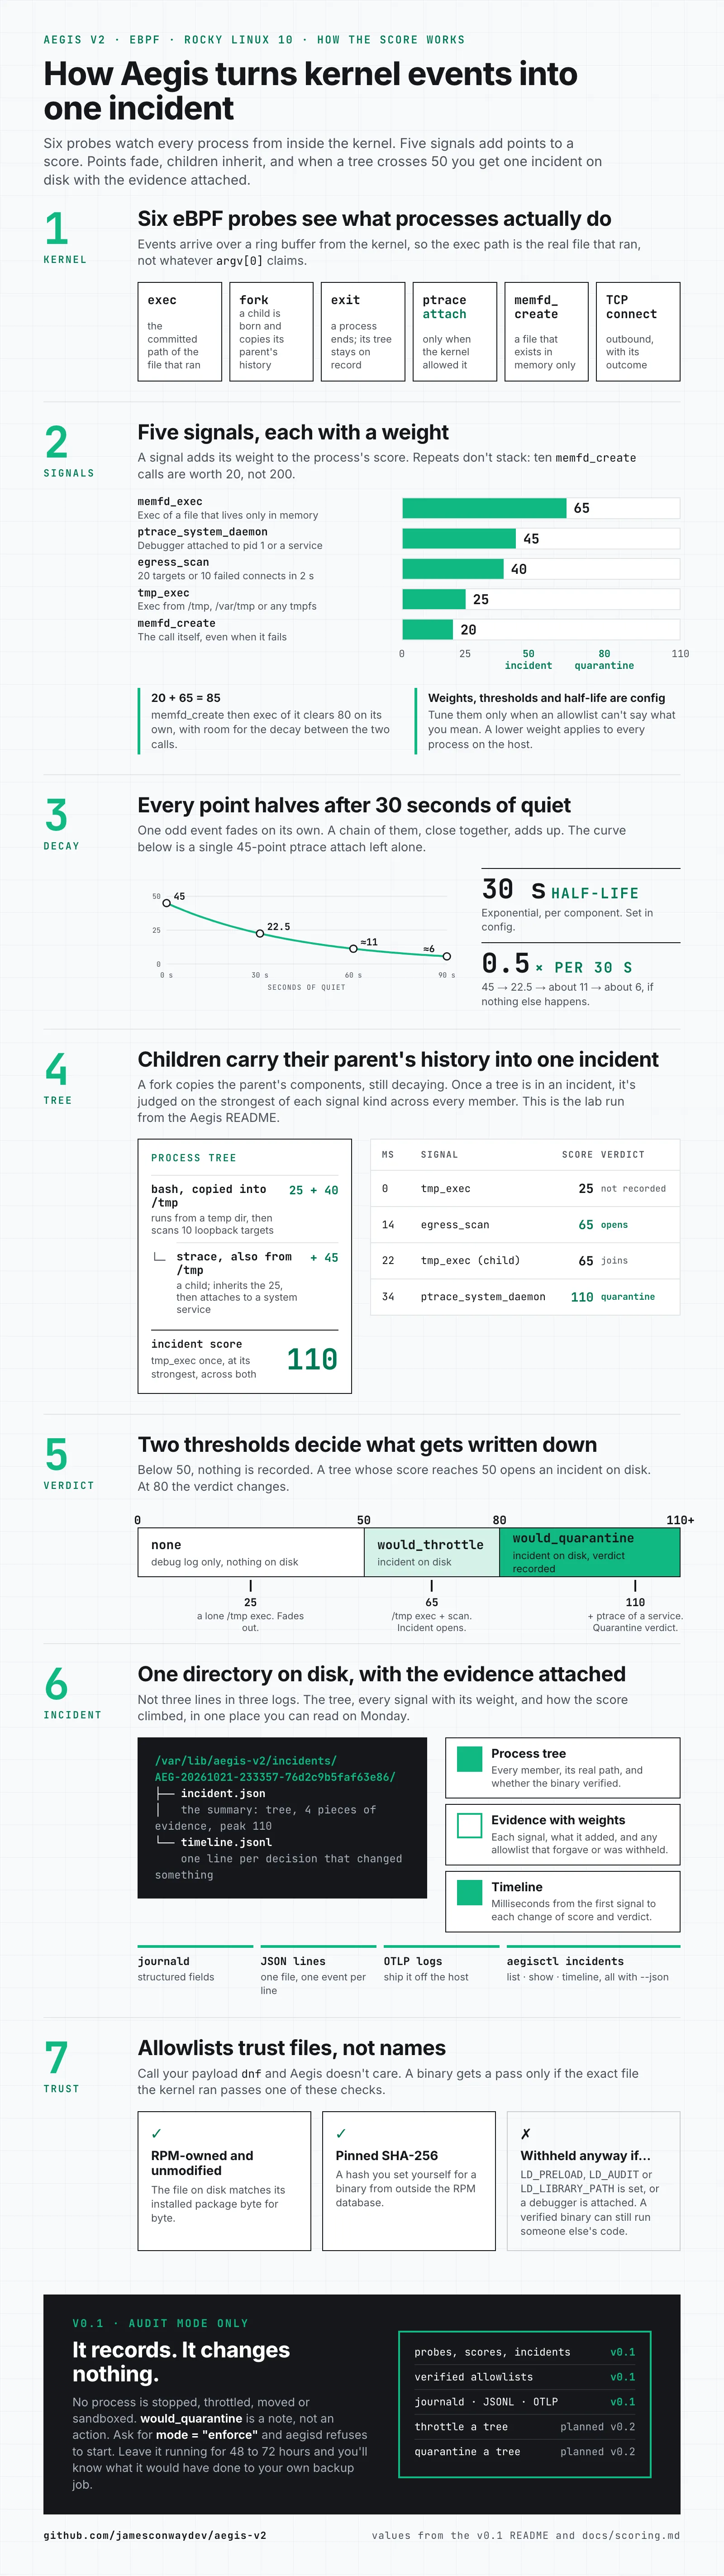
Read the infographic as text
- Aegis watches every exec, fork, exit, ptrace attach,
memfd_createand outbound TCP connect from inside the kernel. - Each signal adds a fixed weight: exec of a memfd 65, debugger on a system daemon 45, egress scan 40, exec from
/tmp25,memfd_create20. A signal counts once per process. - Every point halves after 30 seconds of quiet, so 45 becomes 22.5, then about 11, then about 6.
- Children carry their parent’s history, and a tree is judged on the strongest of each signal across all its members.
- Below 50 nothing is recorded. At 50 an incident opens as
would_throttle; at 80 it becomeswould_quarantine. - An incident is one directory under
/var/lib/aegis-v2/incidents, with the process tree, each piece of evidence and its weight, and a timeline, plus journald, JSON-lines and OTLP output. - Allowlists only pass a binary that is RPM-owned and unmodified or matches a pinned SHA-256, and never one started with
LD_PRELOADor under a debugger. - v0.1 is audit mode only: it records and changes nothing. Enforcement is planned for v0.2.
How It Compares
Smaller, narrower, on purpose
I didn’t build this because the existing tools are bad. They aren’t.
Auditd records system calls faithfully and has been doing it for years. What it gives you is the raw record. Correlating it is your job.
Falco is a mature rules engine with a huge library of detections, and it shines in Kubernetes. It raises an alert each time a rule matches.
Tetragon, from the Cilium project, is eBPF-based too, Kubernetes-aware, and can enforce policy right in the kernel if you write the policy for it.
Aegis is the narrow one. It targets Rocky Linux 10 hosts, ships as an RPM with an SELinux module, and has five signals rather than hundreds of rules. What it does differently is add those signals up across a process tree, with decay, and hand you one incident instead of a stream of alerts.
If you need breadth today, those tools are further along. If you want a quiet tool that tells you a story, that’s the gap I’m aiming at.
What v0.1 Doesn’t Do
Yet
Version 0.1 is an observer. It runs in audit mode only. It scores, records, and reports, and it changes nothing on the host. Ask it for enforce mode, and it refuses to start.
That’s deliberate. Before anything on your server gets throttled or quarantined, you should know exactly what Aegis would have done to your own backup job. A few days in audit mode tells you.
Enforcement is planned for v0.2. It doesn’t ship today, and I’m not going to pretend otherwise.
A Companion to Sentry v2
Two watchers, different windows
If you’ve seen Sentry v2, Aegis is its sibling. Sentry watches the operational side of an EL10 box: memory and I/O pressure, systemd unit failures, and SELinux denials, and it can throttle a noisy service when you let it.
Aegis watches the other window. What processes are doing, from inside the kernel.
They don’t talk to each other. They share a philosophy, though. Both start in a mode that changes nothing, and both make you decide when they’ve earned more.
Kick the Tyres
Somewhere you don't mind poking
The code, the RPMs for x86_64 and aarch64, and the docs are on GitHub. If you’d like to see an incident before you trust it with a real box, examples/lab/run.sh stages one on a throwaway VM using nothing but copies of bash and strace. There’s also a threat model page that lists, in plain words, what Aegis can’t catch. I’d rather you read that first.
I built this for my own servers. If it turns out to be useful on yours, even better. And if it flags something daft, please tell me.
That’s how it gets better.
Share